The Lowest Point on Venus
Unlike the Moon and Mars, Venus' lowest elevations are not found in giant impact basins, because the planet doesn't have any. Venus' largest craters are of the more modest peak ring variety - Mead is 280 km wide and Isabella 210 km, both with floors only 1200m below mean planetary radius. Venus' lack of iconic basins like South Pole-Aitken on the Moon or Hellas on Mars which span thousands of kilometres and plunge many kilometres deep, is possibly due to global resurfacing by volcanic and tectonic activity some 300-500 million years ago. Such a catastrophic event would have buried or erased older impact structures. The craters we see today formed after this event, by which time the era of the largest impactors had passed.Instead, the lowest elevations on Venus are found in vast tectonic rifts known as chasmata - deep and often steep, canyon-like structures formed by crustal extension, likely driven by mantle plumes. These chasmata, including systems like Diana, Devana and Ganis, appear to have formed after the global resurfacing and so are among the youngest large-scale tectonic features on the planet. This work determines the lowest point within the chasmata.
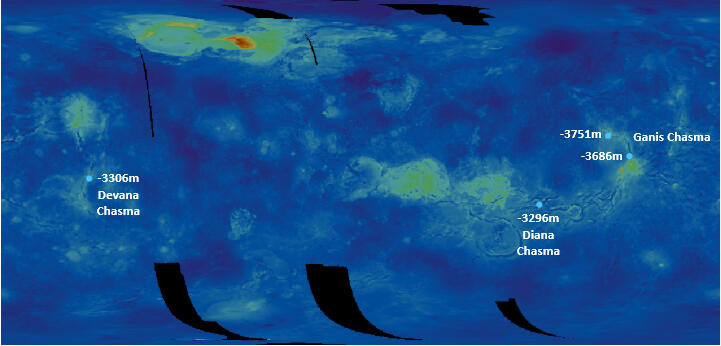
Fig 1
Reported Elevations
Many sources [1-4] identify Diana Chasma as containing the lowest elevation on Venus. Those that provide a specific value and location [5] usually cite an elevation of 2.9 km below the mean planetary radius (MPR), at coordinates (-14°, 156°). This figure can be traced to the official NASA Pioneer Venus mission overview (1983) [6], which states:
'The lowest point is 2.9 km below the mean level, in a rift valley located at 156° east longitude and 14° south latitude'. However, the MPR reference is not specified.The original Pioneer Venus altimetry results (1980) [7] note:
'The lowest point on the planet, at 6049.0 km, is in a small region located in a trench at -14°, 156°'.
This report gives an MPR of 6051.5 ± 0.1 km, placing the same lowest point given in [6] at 2.5 ± 0.1 km below the MPR.Source [8] states that the deepest part of Devana Chasma 'lies among the lowest elevations on Venus', giving a depth of 3.3 km relative to MPR. The study uses the higher resolution Magellan datasets from 1990-93, which the authors observe have 'significantly sharpened our view of faulting in these (extensional rift) structures'.
This Study and Its Results
For the elevation analysis here, I use the Venus Magellan Global Topography 4641m/pixel DEM (Digital Elevation Model), referenced to a MPR of 6051.8 km. Elevation models such as this based on Magellan radar altimetry, remain the most accurate and complete topographic data available for Venus, and are still the standard reference for elevation profiling on the planet. The lowest elevations in chasmata with this DEM are shown in Fig 1, and itemized in Table 1.
| Chasma | Lowest Point Location (lat, lon) | Elevation |
|---|---|---|
| Diana | (-16.327°, 152.684°) | -3296m |
| Devana | (-3.273°, -73.061°) | -3306m |
| Ganis (1) | (7.883°, -161.320°) | -3686m |
| Ganis (2) | (18.399°, -171.988°) | -3751m |
Table 1
The lowest elevation measured in Devana Chasma aligns with the value reported by [8]. Fig 2 shows a transect moving across the deepest part of this chasma, and the corresponding elevation profile along it.
Fig 2
The lowest elevation in Diana Chasma is comparable to that of Devana Chasma. This point lies approximately 420 km southwest along the chasma from the location identified by the Pioneer Venus altimetry [7]. With the Magellan DEM, the closest coordinates to (-14°,156°) at which there is a local low in the chasma, are (-13.827°, 155.936°), where the elevation is -3007m. Fig 3 shows a transect moving across the deepest part of Diana Chasma, and the corresponding elevation profile along it.
Fig 3
Two locations along Ganis Chasma have floor elevations lower than those found in either Diana or Devana Chasma. As described in [9] and shown in Fig 4, Ganis can be divided into three distinct segments based on rift orientation. Segment A trends generally northward from its initiation near Atla Regio. Segment B shifts to a predominantly westward orientation, perhaps influenced by a preexisting lithospheric weakness. Segment C resumes a north-south trend and terminates in the regional plains. The two lowest points in Ganis lie in the initial parts of segments A and C, labeled in Fig 4 as Ganis (1) and Ganis (2), respectively. The Segment B rift is less prominent overall (both narrower and shallower), possibly due to reduced extensional efficiency from a misalignment between the stress field and the rift’s reoriented path.
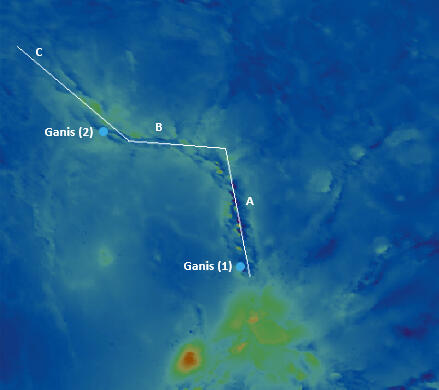
Fig 4
Fig 5 shows a transect moving across Ganis(1) and Fig 6 across Ganis (2), and the corresponding elevation profiles along the transects.
Fig 5
Fig 6
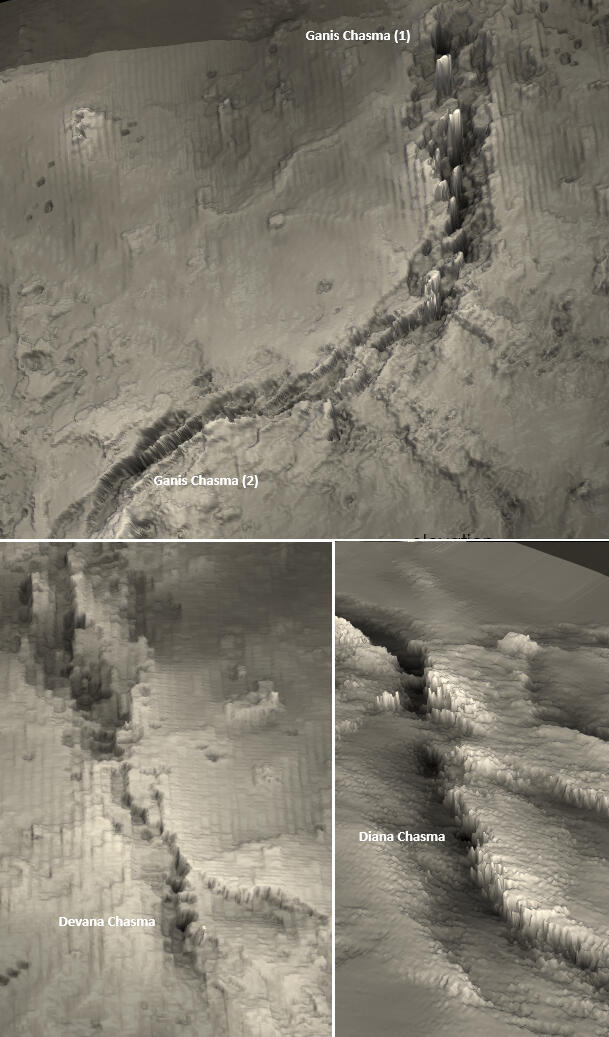
Fig 7
Fig 7 shows 3D renderings of the chasmata segments in Figs 2-6, made from the Global DEM with vertical exaggeration applied. The labels are placed next to the lowest elevations in each of the chasmata.
Stereo DEM Potential
Magellan’s radar instrument operated in multiple modes, but for topographic mapping only the altimeter and SAR (Synthetic Aperture Radar) were relevant. The altimeter, which underpins the Global DEM, measured the time delay of radar pulses to provide broad-scale, long-wavelength elevations. SAR produced high-resolution images of surface backscatter. By comparing SAR images from the mission's mapping Cycles 1 and 3 in stereo, finer elevation differences can be extracted than with altimetry alone. Herrick et al., (2012) developed such a stereo-derived DEM, combining altimetry for long-wavelength control with stereo for finer detail, opening the possibility of improved elevation data for the planet’s lowest-lying regions.Reliable stereo results require high-quality SAR data from both Cycles. Because elevations depend on correctly matching features between images, errors in matching propagate directly to height estimates, while mosaicking artifacts can produce step-like distortions. Where image quality is sufficient, elevations with the Herrick Stereo DEM can be treated as absolute.
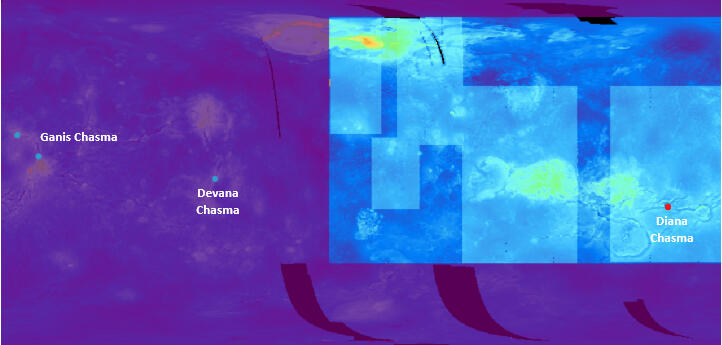
Fig 8
Although Cycle 3 specifically targeted stereo-compatible imaging, spacecraft constraints limited coverage to only about 21% of the surface. Consequently, as shown by the bright blue rectangles in Figure 8, the Herrick Stereo DEM includes Diana Chasma but not Ganis or Devana Chasmata. Within Diana Chasma, this DEM gives a minimum elevation of -3708m at (-16.369°, 152.810°), marked by the red point in Figure 8, located about 13.5 km southeast of the lowest point from the Global DEM (Table 1).
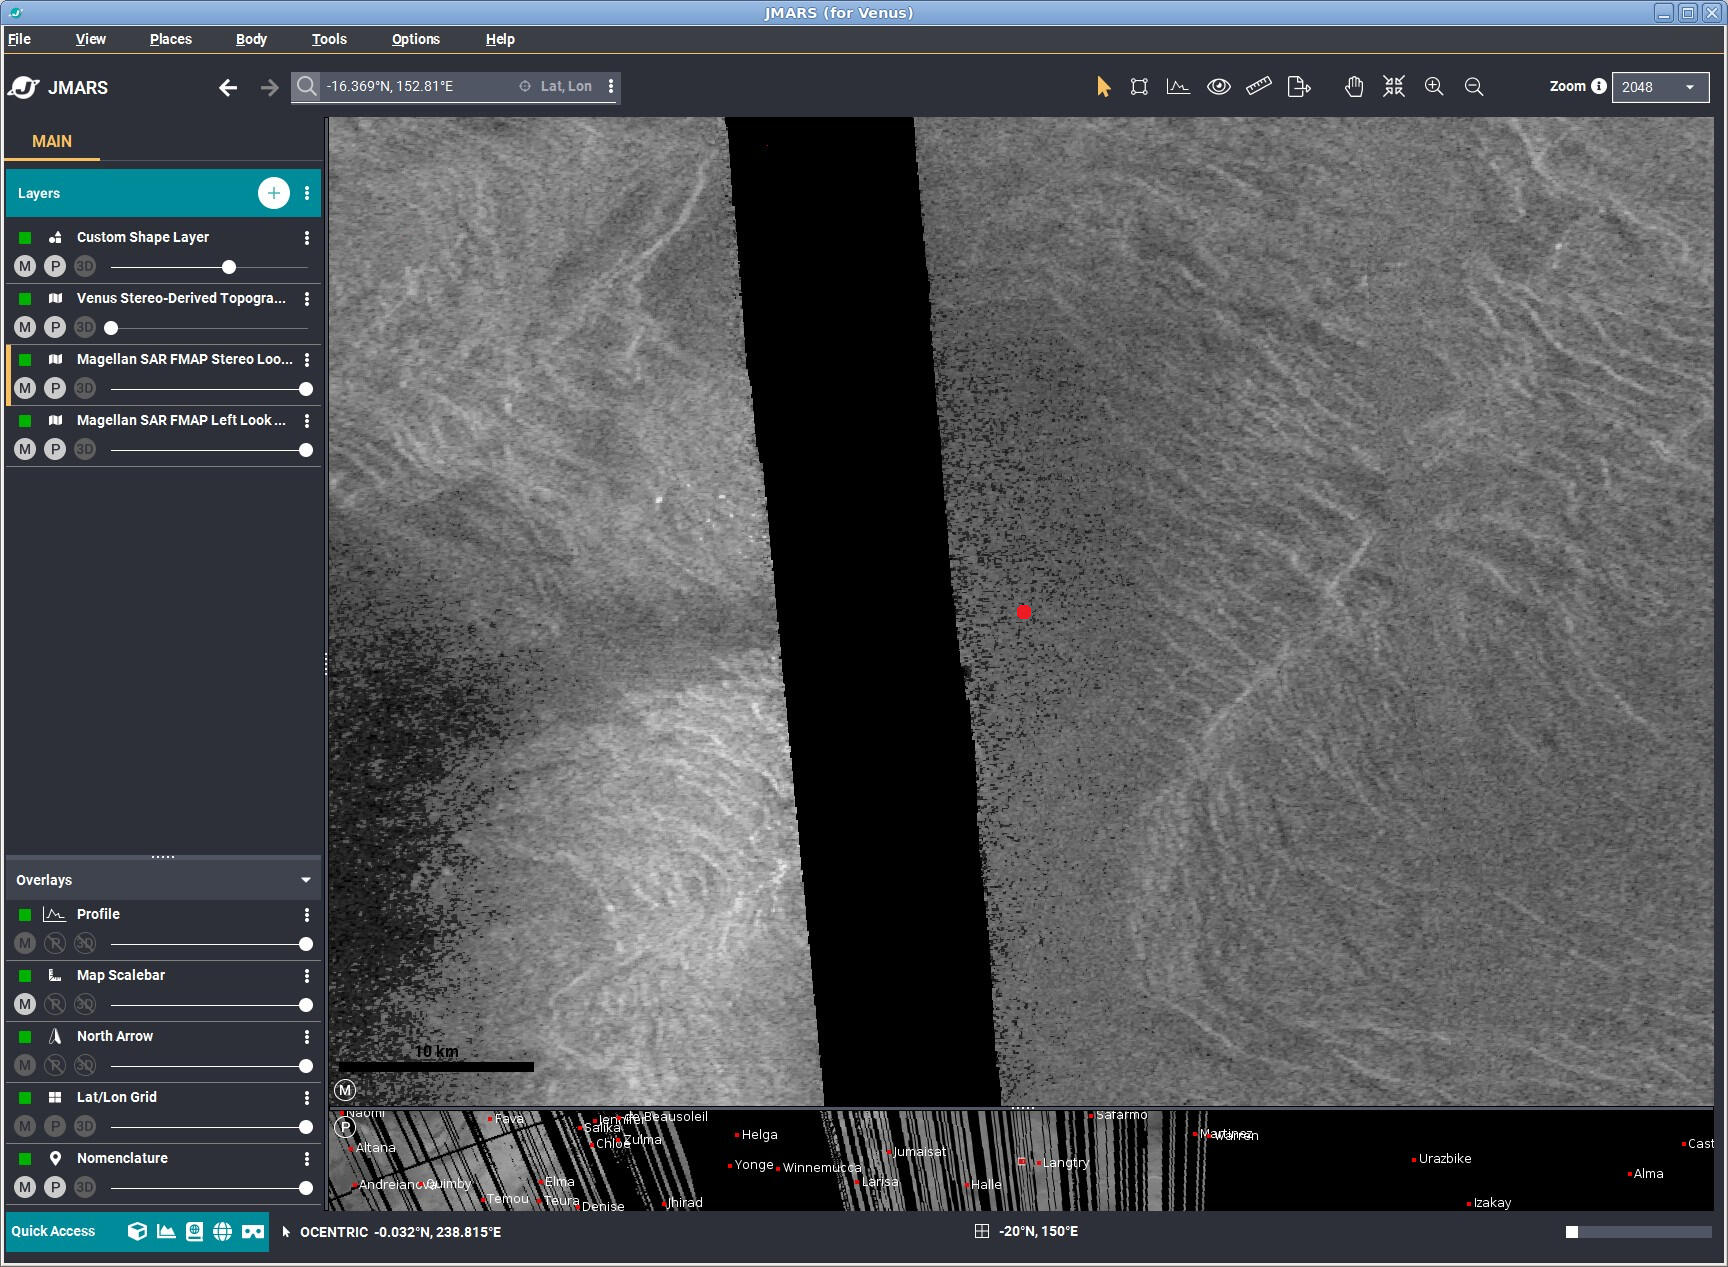
Fig 9
The low point with the Herrick Stereo DEM is also highlighted in red on the JMARS screenshot of the Cycle 3 image in Fig 9. However, the screenshot shows that image quality at this location is insufficient, making the stereo-derived elevation unreliable. As a result, for all chasmata considered in this work, the Global DEM values in Table A remain the most dependable.
Regional Setting of Study Areas
The major chasmata of Devana, Ganis, and Diana are intimately connected to Venus’ most prominent volcanic rises. Devana Chasma radiates outward from Beta Regio, a high-standing volcanic rise thought to be underlain by an active mantle plume, and is centered on the large volcano Theia Mons. To the southeast, Atla Regio - another major volcanic rise - hosts a triple junction rift system. Here, Ganis Chasma extends northeast from Atla in a segmented, arcuate path over 2700 km and is closely associated with the large volcanoes Maat Mons and Ozza Mons. Dali Chasma trends southwest from Atla and merges into Diana Chasma, and together they form a continuous rift system over 7500 km long that links Atla Regio to Thetis Regio, an uplifted region that constitutes the eastern part of Aphrodite Terra, the largest highland on Venus.
Conclusion
This study identified the lowest elevation points in Venusian chasmata using the Venus Magellan Global Topography 4641m/pixel DEM, with elevations reported relative to MPR of 6051.8 km. The analysis shows that Diana and Devana Chasma have floor depths of -3.3 km, while Ganis Chasma reaches -3.7 km, the lowest point on Venus. These values are rounded to the nearest 100m, in line with the vertical accuracy limits of Magellan radar altimetry (typically tens of metres).Animated transects and elevation profiles across each chasma floor were used to visualize and compare their cross-sectional structure.However, it is important to note a limitation in the underlying data: the Global Topographic Data Record (GTDR), from which the Global DEM is derived, has been shown to contain occasional spuriously low elevation values [10]. These artifacts result from limitations in how the Magellan altimeter handled complex topography, where multiple radar echoes in steep, rugged terrain may have led to localized overestimations of depth. As a result, while the general structure and relative positions of low points remain robust, absolute floor elevations may be somewhat shallower than measured.
Author
This study was carried out by Jim Singh and completed on 17 August 2025. It stems from an ongoing collaboration with Daniel Quinn and Oscar Argudo to systematically catalogue all lunar and Martian mountains and craters with topographic prominence (or anti-prominence) of at least 1000m. The effort builds on a 2024 publication documenting 7149 such features on Earth. Progress updates are available at WorldRibus.org.
Acknowledgments
Thanks to Dr. Robert R. Herrick (University of Alaska Fairbanks) for valuable advice and feedback.
References
1. Carr (1984), The Geology of the Terrestrial Planets2. Fegley & Treiman (1992), Chemistry of the Surface and Lower Atmosphere of Venus3. Hansen & López (2003), Geologic Map of the Diana Chasma Quadrangle (USGS I–2752)4. O’Rourke et al. (2023), Venus, the Planet: Introduction to the Evolution of Earth’s Sister Planet, Space Science Reviews, 219:105. Space.com, “How Big is Venus?" (2012)6. Fimmel, Colin & Burgess (1983), Pioneer Venus (NASA SP-461), NASA Scientific and Technical Information Office7. Pettengill, Eliason, Ford, Loriot, Masursky & McGill (1980), Pioneer Venus Radar Results: Altimetry and Surface Properties, Journal of Geophysical Research, 85(A13), 8261–82708. McKenzie (2006), Topographic Analysis of Devana Chasma, Venus9. McKenna, Weller & Kiefer (2023), Initial Analysis of Ganis Chasma, a Complex Rift Zone on Venus, 54th Lunar and Planetary Science Conference, LPI Contribution No. 280610. Gallardo i Peres, Mason & Ghail (2025), A Map of Potential Topographic Anomalies on Venus, Journal of Geophysical Research: Planets
Created by: Jim Singh - Electrical Engineer, Amateur Astronomer, Science Writer. Last Updated: August 2025. If you've found this site useful or have feedback, please drop me a line at jimmyboysingh. Follow that name with an at, then gmail and finish up with a dot and a com.